
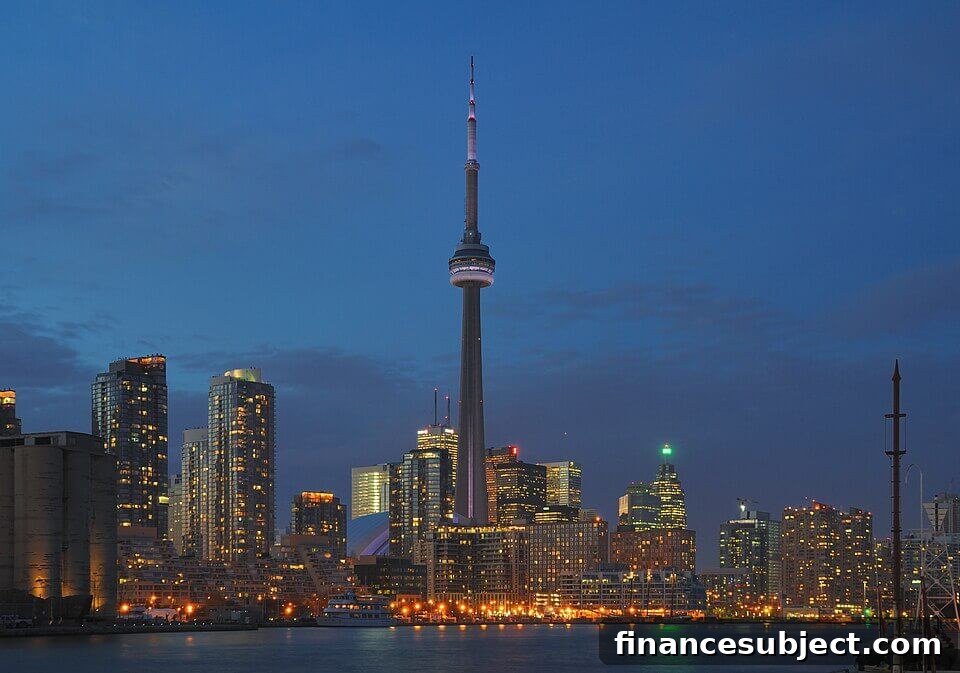
Toronto’s appeal has always been its ability to contain multitudes: cultures, neighbourhoods and now ambitious plans still taking shape. More than $1 billion in waterfront redevelopment is adding housing and parkland in the Port Lands, a new $3‑billion Waterfront East LRT is planned, and the 15.6‑kilometre Ontario Line—with 15 new stations—will reshape how the city moves. Construction cranes and record‑setting towers are already changing the skyline even as the housing market cools, with prices below their peak and forecasts calling for only modest movement in the near term.
For buyers, the question is less whether Toronto is desirable than how to read this moment. Prices have softened even as long‑term investments in transit, parks and new communities accelerate. Timelines for those projects are long and carrying costs are real. Buying today is less about timing the absolute bottom and more about deciding whether you believe in Toronto’s next chapter enough to secure a place before that future is built.
Table of contents: Best places to buy in Toronto
- The 50 best neighbourhoods in Toronto
- Closer look at the top three neighbourhoods
- Real estate trends in Toronto
- What’s next for real estate in Toronto
Best places to buy
Where to Buy Real Estate in 2026
The best places to buy real estate in Toronto 2026
Below are the top Toronto neighbourhoods for real estate purchases in 2026. Use the table to compare average prices, recent growth and scores for value, economics and accessibility. The list highlights where buyers may find opportunity today—whether you’re a first‑time purchaser, a move‑up buyer, or an investor evaluating long‑term fundamentals like transit expansion and redevelopment.
| Rank | Neighbourhood | City | 2025 avg. price index | 1-yr growth | 3-yr growth | 5-yr growth | Value score | Economics score | Accessibility score | Households with children |
|---|---|---|---|---|---|---|---|---|---|---|
| 1 | Downsview‑Roding‑CFB | Toronto | $850,322 | -8% | -7% | 15% | 3.8 | 5.0 | 3.3 | 38% |
| 2 | Edenbridge‑Humber Valley | Toronto | $1,877,000 | 24% | 18% | 20% | 4.8 | 3.2 | 2.5 | 29% |
| 3 | Elms‑Old Rexdale | Toronto | $725,768 | 10% | -4% | 17% | 4.9 | 3.0 | 3.3 | 28% |
| 4 | Corso Italia‑Davenport | Toronto | $1,250,786 | 9% | 11% | 17% | 4.5 | 3.2 | 4.3 | 29% |
| 5 | Centennial Scarborough | Toronto | $1,143,874 | -3% | -17% | 9% | 3.4 | 4.3 | 3.3 | 44% |
| 6 | Humberlea‑Pelmo Park W5 | Toronto | $959,205 | 9% | 6% | 41% | 5.0 | 2.6 | 3.3 | 78% |
| 7 | Guildwood | Toronto | $983,724 | -3% | -11% | 14% | 3.8 | 3.8 | 2.1 | 31% |
| 8 | Markland Wood | Toronto | $1,013,212 | -5% | -3% | 9% | 3.7 | 3.8 | 3.3 | 9% |
| 9 | Islington‑City Centre West | Toronto | $839,561 | 0% | -13% | 6% | 3.9 | 3.5 | 3.3 | 31% |
| 10 | Mount Dennis | Toronto | $743,252 | 6% | -3% | 13% | 4.6 | 2.7 | 3.0 | 36% |
| 11 | Agincourt North | Toronto | $877,159 | -4% | -15% | 20% | 3.8 | 3.5 | 3.0 | 40% |
| 12 | Steeles | Toronto | $900,889 | -3% | -8% | 9% | 3.9 | 3.4 | 2.9 | 36% |
| 13 | Runnymede‑Bloor West Village | Toronto | $1,492,888 | -5% | -3% | 7% | 3.1 | 4.1 | 3.3 | 39% |
| 14 | Etobicoke West Mall | Toronto | $745,456 | 0% | -8% | 16% | 4.3 | 2.9 | 3.0 | 35% |
| 15 | Eglinton East | Toronto | $762,211 | 6% | -12% | 20% | 4.5 | 2.7 | 3.3 | 31% |
| 16 | Alderwood | Toronto | $1,223,465 | -1% | -8% | 7% | 3.5 | 3.6 | 2.9 | 37% |
| 17 | Long Branch | Toronto | $1,059,044 | 4% | -5% | 12% | 4.1 | 3.0 | 2.5 | 20% |
| 18 | Junction Area | Toronto | $1,161,531 | -1% | 3% | 16% | 3.9 | 3.2 | 3.3 | 25% |
| 19 | Danforth Village‑East York | Toronto | $1,220,087 | -4% | -6% | 7% | 3.4 | 3.6 | 3.3 | 31% |
| 20 | Glenfield‑Jane Heights | Toronto | $833,547 | 1% | -6% | 25% | 4.4 | 2.7 | 2.8 | 28% |
| 21 | O’Connor‑Parkview | Toronto | $1,102,006 | 0% | -12% | -7% | 3.5 | 3.5 | 3.3 | 26% |
| 22 | Willowdale East | Toronto | $977,721 | -4% | -12% | 8% | 3.7 | 3.3 | 3.9 | 37% |
| 23 | Dorset Park | Toronto | $675,043 | -7% | -16% | 10% | 3.8 | 3.1 | 3.1 | 45% |
| 24 | Birchcliffe‑Cliffside | Toronto | $1,121,349 | -5% | -13% | 8% | 3.4 | 3.5 | 3.3 | 26% |
| 25 | Humber Summit | Toronto | $896,475 | -6% | -16% | 14% | 3.6 | 3.3 | 2.7 | 38% |
| 26 | Agincourt South‑Malvern West | Toronto | $707,914 | -10% | -13% | 7% | 3.7 | 3.2 | 3.0 | 32% |
| 27 | Morningside | Toronto | $822,478 | 2% | -9% | 18% | 4.3 | 2.6 | 2.0 | 40% |
| 28 | Kingsway South | Toronto | $2,385,324 | -2% | 12% | 20% | 2.6 | 4.2 | 3.3 | 31% |
| 29 | Danforth | Toronto | $1,300,582 | -6% | -6% | 2% | 3.2 | 3.6 | 3.3 | 29% |
| 30 | Rexdale‑Kipling | Toronto | $917,157 | -4% | -9% | 18% | 3.9 | 3.0 | 3.3 | 29% |
| 31 | Mimico | Toronto | $823,416 | -6% | -9% | 6% | 3.8 | 3.0 | 3.4 | 22% |
| 32 | Casa Loma | Toronto | $2,262,538 | 10% | 9% | 25% | 3.5 | 3.2 | 4.0 | 17% |
| 33 | Englemount‑Lawrence | Toronto | $1,198,290 | 6% | -2% | 0% | 4.0 | 2.8 | 3.3 | 28% |
| 34 | Highland Creek | Toronto | $1,227,725 | -11% | -20% | 16% | 2.9 | 3.9 | 0.5 | 47% |
| 35 | Flemingdon Park | Toronto | $543,693 | -2% | -10% | 6% | 4.3 | 2.4 | 2.9 | 33% |
| 36 | Niagara | Toronto | $735,961 | -7% | -9% | 1% | 3.8 | 2.9 | 2.0 | 47% |
| 37 | Kingsview Village‑The Westway | Toronto | $834,112 | -4% | 7% | 16% | 4.3 | 2.4 | 3.3 | 29% |
| 38 | Mount Pleasant East | Toronto | $1,578,520 | -5% | 2% | 9% | 3.1 | 3.5 | 3.9 | 29% |
| 39 | L’Amoreaux | Toronto | $838,299 | -6% | -15% | 14% | 3.7 | 2.9 | 2.9 | 31% |
| 40 | Rosedale‑Moore Park | Toronto | $2,633,102 | 1% | 20% | 10% | 2.6 | 4.1 | 3.3 | 19% |
| 41 | Greenwood‑Coxwell | Toronto | $1,146,871 | -6% | -6% | 4% | 3.4 | 3.2 | 4.3 | 25% |
| 42 | Bayview Village | Toronto | $903,168 | -4% | -15% | 10% | 3.7 | 2.9 | 3.0 | 22% |
| 43 | Wexford‑Maryvale | Toronto | $961,631 | -4% | -11% | 8% | 3.7 | 2.9 | 3.3 | 33% |
| 44 | Weston‑Pellam Park | Toronto | $899,068 | 3% | -16% | -1% | 3.9 | 2.7 | 3.3 | 35% |
| 45 | Lawrence Park South | Toronto | $2,647,360 | -2% | -7% | 7% | 1.8 | 4.8 | 3.3 | 37% |
| 46 | East York | Toronto | $1,371,308 | 2% | -4% | 18% | 3.7 | 2.8 | 3.3 | 42% |
| 47 | Caledonia‑Fairbank | Toronto | $976,682 | -8% | -14% | 6% | 3.4 | 3.2 | 3.3 | 31% |
| 48 | High Park‑Swansea | Toronto | $1,232,573 | -3% | -11% | 10% | 3.4 | 3.1 | 3.3 | 39% |
| 49 | Keelesdale‑Eglinton West | Toronto | $886,139 | 0% | -7% | 9% | 4.1 | 2.5 | 3.5 | 29% |
| 50 | Bayview Woods‑Steeles | Toronto | $1,407,696 | -2% | -7% | 14% | 3.4 | 3.1 | 3.3 | 29% |
| Source: Zoocasa / MoneySense neighbourhood rankings, 2026 | ||||||||||
Top three neighbourhoods in Toronto
1. Downsview–Roding–CFB
Where Toronto once built aircraft, it is now assembling an entirely new urban district. Downsview–Roding–CFB anchors one of North America’s largest redevelopment projects. The neighbourhood posts a perfect Economics Score and strong five‑year appreciation; the average home price is around $850,322.
The workforce here is highly skilled and well paid: median household incomes in the area are notably high and more than two‑thirds of residents hold post‑secondary credentials. Institutional anchors such as Humber River Hospital and nearby York University are helping shape a growing cluster of healthcare and technical jobs, while a large share of families prioritizes parks and sports fields.
Connectivity is a major strength. The area centers on Downsview Park Station—where regional GO service and the subway meet—and benefits from a high transit score. New mid‑rise neighbourhoods and public spaces are steadily filling in the former airfield lands, turning a long‑time industrial site into one of Toronto’s most ambitious urban transformations.
2. Edenbridge–Humber Valley
Edenbridge–Humber Valley stands out by preserving a rare, leafy character rather than adding density. Streets curve along the Humber ravine, mature trees shade wide lots and homes sit back from the street. Those features contribute to a high Value Score, nearly 20% five‑year growth and an average price near $1.88M.
The neighbourhood is home to a stable professional class: a large majority of adults have post‑secondary credentials, many working in management, finance or technical fields. About four in ten households include children, drawn to well‑regarded local schools. Recreational amenities—James Gardens and nearby private golf courses—add lifestyle appeal that helps sustain demand despite a lower accessibility score.
3. Elms–Old Rexdale
Momentum in Elms–Old Rexdale has been building quietly along Finch Avenue as new transit infrastructure repositions the community. With a strong Value Score and roughly 17% five‑year growth, the neighbourhood is among the city’s best value plays, with an average home price near $725,768.
Residents are well educated and entrepreneurial; a high share hold post‑secondary credentials, and the area’s mix of young professionals, immigrant families and small businesses gives it a lively, diverse character. Owner‑occupancy rates show a balance between long‑term owners and new buyers.
Transit improvements—especially the Finch West corridor—have increased the neighbourhood’s accessibility, turning formerly isolated streets into a connected rapid‑transit corridor and making Elms–Old Rexdale one of northwest Toronto’s most notable growth zones.
What’s happened in the Toronto market?
The correction in Toronto’s housing market has hit investors hardest. Many condo listings that peaked in 2022 now show substantially lower asking prices, and investors who bought at the top expecting rents and rapid appreciation to cover carrying costs have been posting steady listings. That supply pressure has helped push prices down and opened opportunities for end‑users.
For first‑time buyers, entry points into Toronto have rarely been this accessible: a 20% down payment today takes far less capital than two years ago. If values recover even modestly, the upside could be significant. At the same time, many buyers remain cautious.
Beyond condos, freehold buyers are seeing attractive pricing. Turnkey detached homes in average Toronto neighbourhoods typically fall in the $1.3M–$1.6M range, with prime areas above that. Move‑up buyers may find this environment advantageous: in a downturn, trading up can be more affordable because prices on higher‑end homes have also softened.
While headlines highlight uncertainty, agents and some buyers see opportunity. For those ready to act, securing financing and moving decisively can matter: buying during this window may deliver gains if the market stabilizes or resumes growth.
Resource highlight
Compare mortgage rates in minutes
Answer a few quick questions to get a personalized quote whether you’re buying, renewing or refinancing.
Powered by ratehub.ca
Return to top.
What’s next for real estate in Toronto?
Two structural forces suggest buyers’ advantage today may not last. New condo starts have fallen sharply; units not started now won’t arrive for three to four years, tightening future supply. Separately, immigration policy and population flows remain an X‑factor—if inflows rise again, demand will increase, especially for accessible segments of the market.
In practice, 2026 looks like a strategic year. Buyers are returning to thorough inspections, negotiating longer closings, and taking time to find the right home without the pressure of bidding wars. Sellers who price clearly and competitively are rewarded: many properties still sell near ask, while poorly priced listings can stagnate.
No one is giving homes away, but this market is more accessible than it has been in years. Accessible price points do not last forever, and waiting for a perfect bottom can mean missing a rare buying window. If you’re considering Toronto real estate, get a pre‑approval, start viewing and treat this market as a strategic opportunity rather than a flawless one.
Return to top.
Newsletter
Get free MoneySense tips, news & advice in your inbox.
Read more about buying a home:
- The complete guide for first‑time home buyers in Canada
- Buying a second home: How it works in Canada
- Mortgage affordability calculator
- How changes to the Home Buyers’ Plan could affect your down payment
This article was created by Zoocasa.
This is an unpaid article written by a content partner based on its expertise and edited by MoneySense.
This article is presented by Ratehub.ca.
This editorial content was presented with financial support from an advertiser. The advertiser had no influence on the creation of the content.