

The first month of the year brings a familiar checklist for many Canadian investors: new tax-free savings account (TFSA) contribution room — $7,000 for 2026 — and the annual push to complete registered retirement savings plan (RRSP) contributions within the first 60 days for the prior tax year.
Bank advisors know this cadence well. If you have cash sitting idle, you may receive an invitation to review your financial plan or visit a branch. The common aim is to move that cash into the institution’s in-house products.
For older clients or those identified as lower risk through know-your-client processes, conversations often turn to market-linked guaranteed investment certificates (GICs). These products are promoted as a way to participate in stock market gains while protecting principal.
That pitch has worked for decades. In 2026, however, exchange-traded funds (ETFs) have entered the same territory with products often called buffer ETFs. Like market-linked GICs, buffer ETFs try to limit downside while offering some upside exposure.
Investors should be cautious. Added complexity usually brings higher costs, fine print, and a steeper learning curve. When people own products they do not fully understand, it becomes harder to remain invested through normal market volatility, regardless of a product’s intended design.
This article explains how market-linked GICs and buffer ETFs work in 2026, highlights the main trade-offs and costs that are easy to overlook, and offers a candid assessment of when either option might suit risk-averse investors, beginners and experienced savers alike.
How market-linked GICs work
Market-linked GICs protect your principal if you hold them to maturity and are often eligible for Canada Deposit Insurance Corporation (CDIC) coverage within normal limits. Their difference from traditional GICs lies in how returns are calculated.
Rather than paying a fixed interest rate, a market-linked GIC’s payout depends on a predefined market benchmark, such as a stock index or a basket of stocks. If the benchmark performs well, your return increases; if it performs poorly, you receive a guaranteed minimum return.
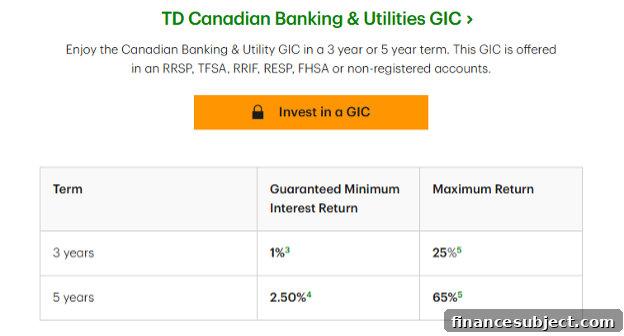
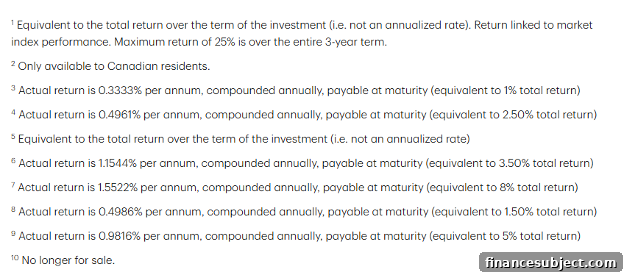
Take, for example, a bank’s market growth GIC linked to a basket of major Canadian banks. A three-year version might guarantee a minimum total return of 3.5% over the term, while a five-year version might guarantee an 8% total return. These guaranteed totals translate into modest annualized rates — the five-year 8% total equates to roughly 1.55% per year.
Upside participation is usually capped. A three-year product could limit cumulative returns to 18%, and a five-year product to 32% — totals, not annualized figures. That cap means if the underlying market rallies strongly, gains beyond the cap do not accrue to the investor.
The fine print matters. Investors often mistake cumulative returns for annualized returns or assume the cap is a likely outcome rather than the absolute upper limit. Banks earn fees for structuring and distributing these GICs, which helps explain their appeal to issuers despite conservative-looking guarantees.
In short, market-linked GICs offer real principal protection if held to maturity, but they trade away much of the upside and can be misunderstood by buyers who don’t read the terms closely.
Rankings
Compare the best HISAs rates in Canada
How buffer ETFs work
Buffer ETFs try to produce a similar payoff profile to market-linked GICs — limiting some downside while offering partial upside — but they do so with key structural differences that affect risk, cost and timing.
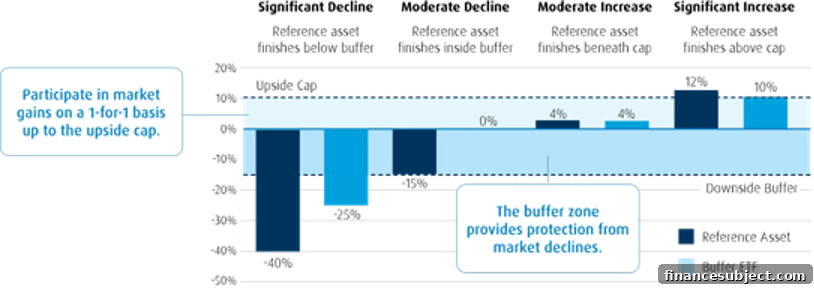
Most importantly, buffer ETFs do not guarantee principal. They are not CDIC-protected, and their downside protection is limited to a predefined range and time window, typically one year. In return for that limited protection, buffer ETFs often offer greater upside potential than market-linked GICs.
Many buffer ETFs achieve their profile by holding an equity exposure alongside a package of options that provide a buffer against initial losses but cap upside. For example, a set of ETFs referencing the S&P 500’s price performance may be constructed using the issuer’s S&P 500 ETF (currency-hedged or unhedged) plus over-the-counter options to create the buffer and cap.
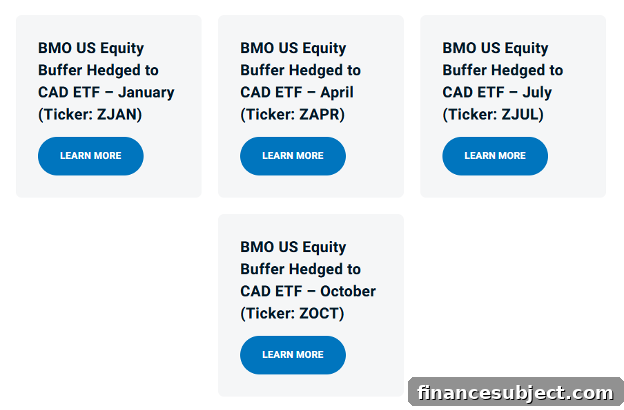
Unlike a GIC, the buffer on these ETFs only applies if you buy at the start of the outcome period and hold to the end. Providers issue different vintages that begin on staggered start dates — for example, January, April, July and October — so investors can choose an entry point. Buying mid-vintage can mean reduced or no protection because the buffer may already be partly used up.
Consider a January vintage that aims to protect the first 15% of losses in the reference index over a one-year outcome period. If the index falls 20% over that year, the buffer would absorb the first 15% and the ETF would fall roughly 5% in value. That protection is real but finite.
The downside protection is financed by selling future upside. In the same vintage, the maximum annual return might be capped at around 7.9%. If the index rises 10% or 15%, any gains above the cap are not passed through to holders.
Costs are another factor. Buffer ETFs commonly carry management expense ratios many times higher than a plain-vanilla S&P 500 ETF; a ME R of 0.73% is not unusual, which significantly lowers net returns when combined with an upside cap.
Buffer ETFs can suit risk-averse investors who prize a narrower range of possible outcomes and who understand the timing and trade-offs. They are more complex than simple index ETFs and require active attention to vintages and outcome periods.
Are market-linked GICs and buffer ETFs worth it?
The answer depends on where you start. For someone who has always kept money in traditional GICs or a savings account and is uncomfortable with stock market swings, market-linked GICs or buffer ETFs can be a gentle way to gain market exposure without full volatility. These structured options may help prevent panic selling during downturns by offering psychological comfort.
However, for experienced investors who understand portfolio construction and volatility, these products often look unnecessary: they are more expensive, more complex, and come with capped upside or limited protection that can be replicated more cheaply with basic building blocks.
As an example, consider a back test from January 2016 through December 2025 comparing two portfolios. Portfolio A held 100% in a Canadian dollar-hedged S&P 500 ETF. Portfolio B held 60% in that same equity ETF and 40% in cash, rebalanced annually. This period included several stress events: the March 2020 pandemic selloff, the 2022 bear market, and the April 2025 tariff-driven drawdown.
| Portfolio performance statistics | ||
| Metric | 100% stocks | 60/40 stocks/cash |
| Start balance | $10,000 | $10,000 |
| End balance | $34,419 | $23,485 |
| Annualized return (CAGR) | 13.16% | 8.91% |
| Standard deviation | 15.22% | 9.04% |
| Best year | 30.17% | 18.77% |
| Worst year | -19.25% | -10.67% |
| Maximum drawdown | -24.90% | -14.46% |
| Sharpe ratio | 0.77 | 0.79 |
| Sortino ratio | 1.16 | 1.19 |
The all-equity portfolio delivered higher long-term returns but with greater volatility and a deeper maximum drawdown. The 60/40 stocks-and-cash portfolio produced lower returns but materially reduced volatility and drawdowns, and its annualized return in that period exceeded the upside cap on many buffer ETFs.
The takeaway: structured products can be useful as an intermediate step for cautious beginners who otherwise avoid markets. But investors who grasp how volatility and diversification work can often achieve a superior risk-return balance using simple ingredients — stocks, bonds (or cash) and disciplined rebalancing — at far lower cost.
Newsletter
Get free financial tips, news & advice in your inbox.
Read more about investing with ETFs:
- Why Canadian investors should avoid MLPs
- If not bonds, then what?
- Can you hedge against a market crash with ETFs?
- Covered call ETFs have high yields but come with a trade-off
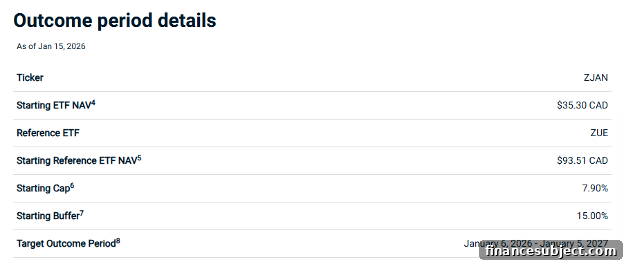
Sources: issuer materials and portfolio performance analysis, January 2026.