
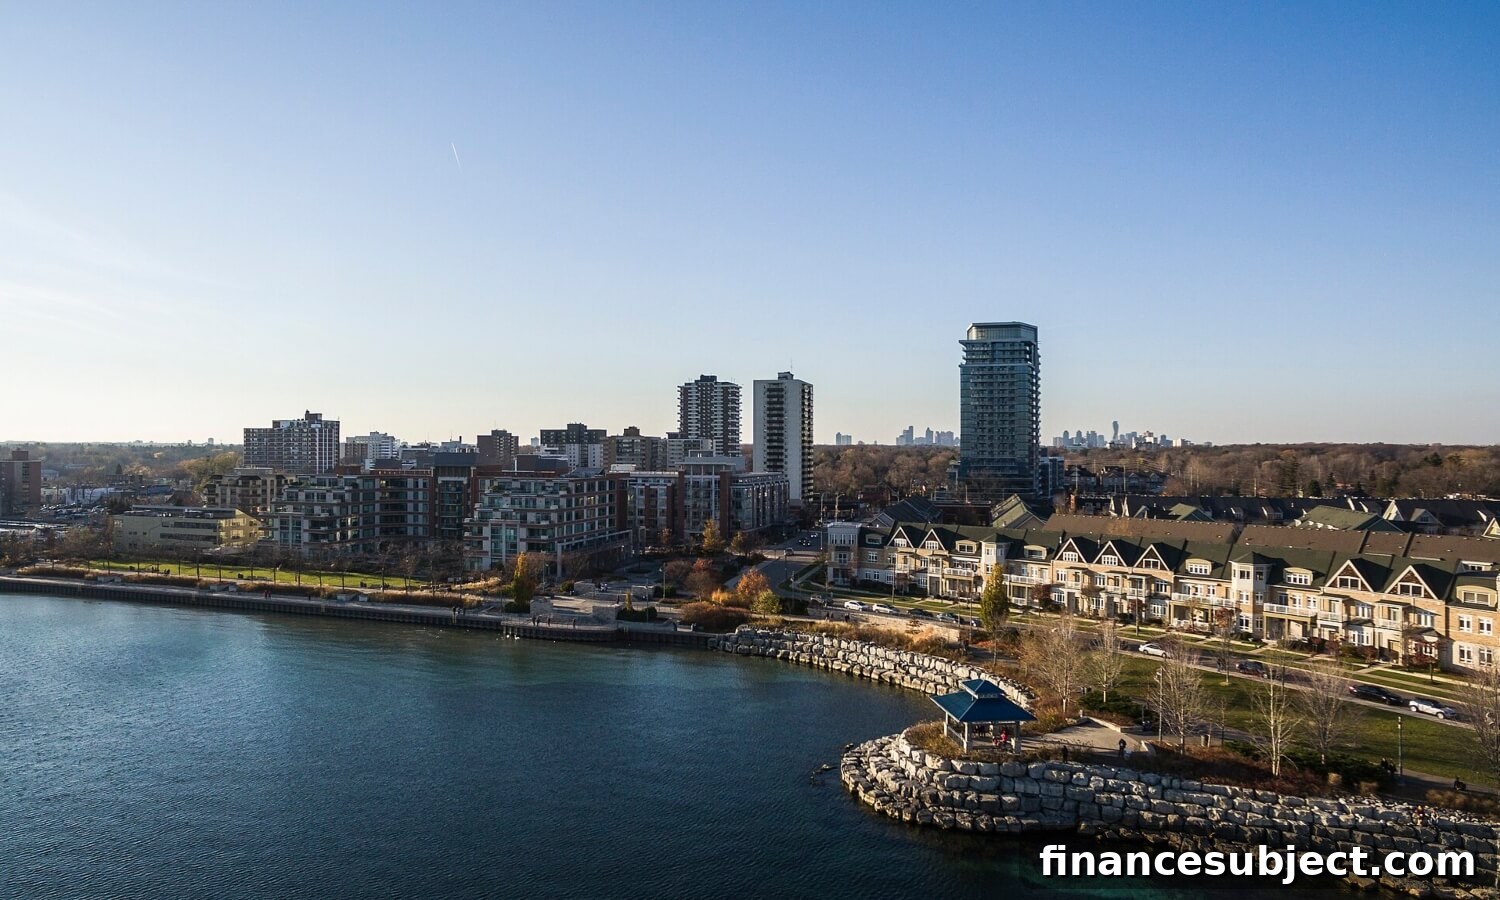
From Blue Jays games at Rogers Centre to weekend hikes in Rouge Valley, life in the Greater Toronto Area (GTA) moves at the pace you choose. With a population exceeding seven million, high prices have kept many buyers on the sidelines — but as the market recalibrates in 2026, opportunities are emerging for buyers who are ready to look beyond headline listings and spot real value in neighbourhoods across the region.
- The 50 best neighbourhoods in the GTA
- Closer look at the top three neighbourhoods
- GTA real estate trends
Best places to buy
Where to Buy Real Estate in 2026
The best places to buy real estate in the GTA
Below are the top 50 neighbourhoods across the GTA for buyers in 2026. The table lists rank, city, neighbourhood name, average sold price in 2025, one-, three- and five-year price growth, value and economic scores, accessibility rating, and the share of private households with children. Use this to compare areas and refine your search.
| Rank | City | Neighbourhood Name | Avg Price 2025 | 1-yr growth | 3-yr growth | 5-yr growth | Value Score | Neighbourhood Economics Score | Neighbourhood Accessibility Score | % Private Households With children in a census family |
|---|---|---|---|---|---|---|---|---|---|---|
| 1 | Burlington | Tansley | $739,942 | 1% | -15% | 28% | 3.7 | 4.2 | 2.5 | 53% |
| 2 | Scugog/Scugog 34 | Blackstock | $1,045,000 | 33% | 4% | 47% | 4.7 | 3.2 | 1.4 | 43% |
| 3 | Burlington | Headon | $1,026,388 | 1% | -9% | 37% | 3.4 | 4.2 | 2.5 | 53% |
| 4 | Burlington | Palmer | $922,380 | -5% | -5% | 25% | 3.4 | 4.2 | 2.5 | 53% |
| 5 | Oakville | Clearview | $1,466,845 | -5% | -10% | 16% | 2.3 | 5.0 | 0.9 | 54% |
| 6 | Mississauga | City Centre | $540,492 | -11% | -21% | 2% | 3.3 | 3.9 | 2.1 | 43% |
| 7 | Oakville | Glen Abbey | $1,368,429 | -1% | -7% | 31% | 2.8 | 4.4 | 1.6 | 66% |
| 8 | Pickering | Town Centre | $636,105 | -6% | -13% | 15% | 3.6 | 3.6 | 3.9 | 55% |
| 9 | Brampton | Northgate | $800,392 | -5% | -18% | 14% | 3.2 | 3.9 | 0.2 | 54% |
| 10 | Burlington | Uptown | $708,103 | -5% | -14% | 23% | 3.6 | 3.6 | 1.8 | 49% |
| 11 | Burlington | Alton | $1,060,434 | -1% | -19% | 14% | 2.9 | 4.2 | 2.5 | 53% |
| 12 | Uxbridge | Uxbridge | $1,113,252 | 7% | -3% | 39% | 3.6 | 3.5 | 3.0 | 47% |
| 13 | Oakville | West Oak Trails | $1,272,042 | -8% | -8% | 18% | 2.6 | 4.4 | 1.6 | 66% |
| 14 | Pickering | Bay Ridges | $714,741 | -4% | -18% | 10% | 3.4 | 3.6 | 3.1 | 45% |
| 15 | Pickering | Liverpool | $1,025,701 | 1% | -9% | 29% | 3.4 | 3.6 | 3.9 | 55% |
| 16 | Milton | Dempsey | $831,592 | 1% | -14% | 20% | 3.5 | 3.4 | 2.7 | 60% |
| 17 | Whitby | Downtown Whitby | $792,812 | -6% | -13% | 23% | 3.4 | 3.5 | 4.0 | 43% |
| 18 | Burlington | Rose | $1,292,549 | -4% | -12% | 24% | 2.7 | 4.2 | 2.5 | 53% |
| 19 | Burlington | Appleby | $969,741 | -1% | -7% | 13% | 3.3 | 3.6 | 1.8 | 49% |
| 20 | Burlington | Orchard | $1,092,599 | -1% | -7% | 35% | 3.3 | 3.6 | 1.8 | 49% |
| 21 | Mississauga | Churchill Meadows | $1,038,547 | -4% | -15% | 15% | 3.0 | 3.9 | 1.2 | 63% |
| 22 | Pickering | West Shore | $895,235 | -4% | -15% | 25% | 3.3 | 3.6 | 2.2 | 45% |
| 23 | Clarington | Bowmanville | $790,918 | -4% | -14% | 25% | 3.5 | 3.3 | 3.3 | 52% |
| 24 | Whitby | Port Whitby | $808,354 | -4% | -16% | 18% | 3.3 | 3.5 | 1.1 | 43% |
| 25 | Pickering | Village East | $671,089 | -13% | -16% | 10% | 3.2 | 3.6 | 3.6 | 55% |
| 26 | Milton | Timberlea | $935,060 | -1% | -8% | 21% | 3.4 | 3.4 | 2.7 | 60% |
| 27 | Brampton | Heart Lake West | $883,621 | -10% | -21% | 12% | 2.9 | 3.9 | 0.8 | 58% |
| 28 | Clarington | Newcastle | $771,543 | -6% | -17% | 29% | 3.4 | 3.3 | 2.7 | 39% |
| 29 | Whitby | Pringle Creek | $847,966 | -5% | -16% | 21% | 3.3 | 3.5 | 2.7 | 63% |
| 30 | Milton | Dorset Park | $956,266 | -4% | -4% | 21% | 3.3 | 3.4 | 2.7 | 60% |
| 31 | Whitby | Brooklin | $1,118,296 | 1% | -8% | 34% | 3.3 | 3.5 | 2.5 | 66% |
| 32 | Pickering | Duffin Heights | $745,853 | -8% | -23% | 11% | 3.1 | 3.6 | 3.2 | 62% |
| 33 | Oakville | River Oaks | $1,021,878 | -6% | -15% | 15% | 2.9 | 3.7 | 2.1 | 56% |
| 34 | Burlington | Brant Hills | $916,502 | 1% | -10% | 25% | 3.5 | 3.1 | 2.8 | 48% |
| 35 | Newmarket | Central Newmarket | $832,932 | -3% | -14% | 17% | 3.4 | 3.3 | 4.0 | 44.5% |
| 36 | Whitby | Taunton North | $1,035,892 | -4% | -11% | 27% | 3.1 | 3.5 | 2.8 | 63% |
| 37 | Pickering | Woodlands | $994,288 | -3% | -15% | 13% | 3.0 | 3.6 | 1.8 | 55% |
| 38 | Oshawa | Central | $627,880 | -1% | -13% | 23% | 3.8 | 2.8 | 3.5 | 36% |
| 39 | Pickering | Rouge Park | $984,273 | -4% | -17% | 14% | 3.0 | 3.6 | 1.5 | 55% |
| 40 | Clarington | Courtice | $822,031 | -8% | -17% | 22% | 3.2 | 3.3 | 1.0 | 57% |
| 41 | Milton | Bronte Meadows | $1,016,333 | -3% | -11% | 24% | 3.2 | 3.4 | 2.7 | 60% |
| 42 | Whitby | Lynde Creek | $948,569 | -7% | -14% | 23% | 3.1 | 3.5 | 2.1 | 43% |
| 43 | Milton | Clarke | $949,984 | -6% | -12% | 22% | 3.2 | 3.4 | 2.7 | 60% |
| 44 | Mississauga | Lakeview | $968,947 | 3% | -10% | 29% | 3.5 | 3.1 | 3.6 | 41% |
| 45 | Brampton | Fletcher’s West | $901,894 | -13% | -25% | 8% | 2.6 | 3.9 | 0.8 | 55% |
| 46 | Pickering | Amberlea | $1,059,577 | -6% | -13% | 21% | 3.0 | 3.6 | 2.5 | 55% |
| 47 | Halton Hills | Georgetown | $1,031,385 | 0% | -14% | 18% | 3.1 | 3.4 | 2.1 | 55% |
| 48 | Oakville | College Park | $1,037,342 | -6% | -15% | 3% | 2.8 | 3.7 | 2.1 | 56% |
| 49 | Aurora | Aurora Village | $1,226,129 | 7% | 2% | 49% | 3.6 | 2.9 | 3.2 | 56.3% |
| 50 | Whitby | Blue Grass Meadows | $905,685 | -8% | -19% | 23% | 3.0 | 3.5 | 2.3 | 43% |
| Source: Zoocasa data, 2026 | ||||||||||
Top three neighbourhoods in the GTA
Tansley tops the list in 2026 because it combines strong household economics with long-term stability. The average sold price in 2025 was $739,942 and its Value Score of 3.7 reflects solid relative affordability and appeal. An Economic Score of 4.2 points to a highly qualified workforce: roughly three-quarters of residents hold post‑secondary credentials and median household income in the area is healthy.
Community life centers on Tansley Woods Community Centre, where sports fields, library services and local programs keep families engaged. Recent investments in nearby recreational infrastructure, such as upgrades at Skyway Community Centre, show the kind of public amenity improvements that reinforce neighbourhood livability.
Accessibility is practical rather than urban-transit driven: with an Accessibility Score of 2.5, Tansley benefits from quick connections to the QEW and Highway 407, making commuting to Toronto or Hamilton feasible while preserving a quieter suburban feel.
Blackstock has emerged as one of the GTA’s most surprising success stories. Now ranked second, the area recorded 47.2% growth over five years and an average 2025 sale price of $1,045,000. Its high Value Score (4.7) reflects strong appreciation and investor interest as buyers move outward seeking space and long-term value.
Properties in and around Lake Scugog Meadows tend to sit on larger lots and border conservation lands, attracting buyers who prioritize privacy, outdoor space and rural character over proximity to downtown amenities. That lifestyle trade-off is central to Blackstock’s appeal.
Transit access is limited (Accessibility Score 1.4), but for many buyers that’s deliberate: they’re investing in land, tranquillity and a regionally oriented lifestyle rather than daily transit commutes.
Headon Forest ranks third, combining steady price growth with enduring livability. The average 2025 sale price was $1,026,388 and five‑year growth reached nearly 37%. A Value Score of 3.4 and an Economic Score of 4.2 underline the neighbourhood’s family-focused, professional demographic.
Quality schools such as Dr. Frank J. Hayden Secondary School and Notre Dame Catholic Secondary School help maintain the area’s family appeal; more than half of households in Headon include children. Its Accessibility Score of 2.5 reflects convenient links to the QEW and Highway 407, offering commuter-friendly routes without sacrificing neighbourhood calm.
What’s happened in the GTA real estate market?
The frenzied market of 2021–2022 has cooled into a more measured environment. While desirable, well-priced and move-in-ready properties still attract multiple offers, that activity represents a smaller share of listings. Many homes with dated interiors or visible deferred maintenance are being overlooked by buyers not willing to take on renovation projects.
At the same time, turnkey townhouses and semi‑detached homes priced roughly between $1 million and $1.5 million are serving as a new, popular entry point for first-time buyers who are bypassing the condo market. Investor-held small condo units are more likely to sit vacant, and some preconstruction closings are still coming through, adding supply pressure in specific segments.
Many first-time buyers are older than a decade ago. Those in their late 20s or early 30s often rely on family help, while others delay buying into their mid-30s or later to save for a down payment.
What’s next for real estate in the GTA?
For the first time in several years, the market is giving buyers more time to prepare and negotiate. The rush to submit offers within hours of a new listing has eased; buyers who wait, research and return when they’re ready are frequently better positioned to negotiate. Homes that need work are spending longer on the market, creating room for buyers who are willing to look past cosmetic flaws.
Supply dynamics are nuanced. A broad wave of freehold homes coming to market is unlikely; many long-term owners are content to stay put, and a significant portion of the housing stock is tied up with older homeowners who are not motivated to sell. That relative scarcity of move-in-ready freehold inventory can help support prices over time.
The GTA isn’t offering bargain-basement prices, but it is restoring a margin for careful buyers. Those who combine a clear search strategy with a willingness to see beyond surface issues may find 2026 presents timely buying opportunities. With preparation and patience, buyers can avoid the impulse-driven mistakes of earlier years and secure properties that match both their needs and their budgets.
Return to menu.
Newsletter
Get free MoneySense financial tips, news & advice in your inbox.
Read more about buying a home:
- The complete guide for first-time home buyers in Canada
- The best first home savings accounts in Canada
- Why are mortgages so expensive in Canada?
- Mortgage affordability calculator
This article was created by Zoocasa.
This article was provided by a content partner and edited by MoneySense. It is an unpaid editorial piece based on Zoocasa’s market data and analysis.
This article is presented by Ratehub.ca.
This content is editorially driven and presented with financial support from an advertiser. The advertiser did not influence the creation of the content.